HPLC GRAPH PEAK INTEGRATION GUIDLINS & METHOD

 HPLC GRAPH PEAK INTEGRATION GUIDLINS & METHOD

Where do you start checking when reproducibility is poor for peak areas or quantitation values? Should you suspect a pump delivery malfunction or auto injector injection malfunction and start inspecting the equipment?
No, just wait a minute. First, investigate whether chromatogram peaks are being integrated properly and the baseline correction line is appropriate. A slight difference in peak integration parameters can make a big difference. In fact, by reviewing the data a little, it may be possible to avoid the trouble of acquiring data again.

1. Eliminating Noise and Other Unwanted Peaks

Width Value and Peak Detection

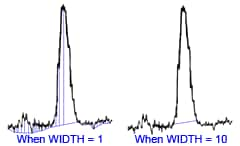
In some cases, peaks are not integrated correctly because target peaks contain noise. In such cases, verify that the peak integration parameters (or peak integration commands) in the method (analytical file) used to analyze data are appropriate. In some cases, the way the peak is detected can be changed by changing the width setting, as shown on the right.

FWHM

Normally, unwanted noise or other peaks can be eliminated by setting [WIDTH] (units: seconds) greater than the full width at half maximum (FWHM) of the unwanted peaks or setting [SLOPE] (units: µV/sec) greater than the leading slope of the unwanted peaks.

Slope of Peaks

Note: Rather than changing the peak integration parameters for each set of data, set those parameters when developing a method so that peaks can be integrated using the same peak integration parameters for all data measured under the same analytical conditions.

2. Integration of Unseparated Peaks

• Using Time Programs

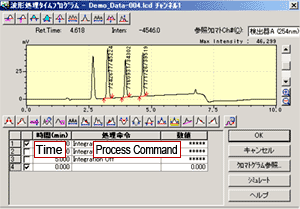
[Integration Time Program]

Even if appropriate integration is not possible using regular peak integration parameters, appropriate integration may be possible using a time program that specifies integration at specific times ([Integration Time Program] 

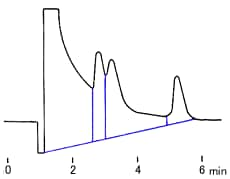
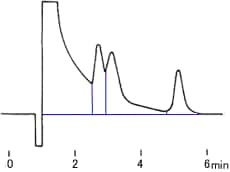
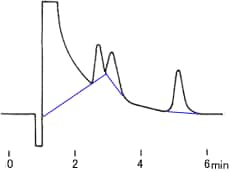
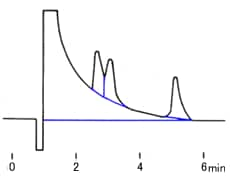
Figures A through D show how the method used to integrate peaks in the same chromatogram can have a large effect on area values.
In Figure A, a baseline correction line is drawn from an unwanted negative peak, so that calculated peak areas are excessively large. If the [Negative Peak Reject] is specified in the time program (starting after 0.5 minutes and clearing after 2 minutes), the effects of negative peaks are eliminated, as shown in Figure B.

( negative peaks can be rejected by specifying
[Negative Peak Reject]

Fig. A Without Rejecting Unwanted Negative Peaks

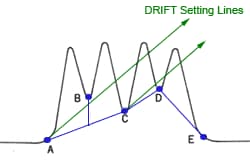
Next, changing the [Drift] setting (see figure below) allows selecting either vertical partitioning (Fig. B) or baseline partitioning (Fig. C).

Relationship Between the DRIFT Setting Lines and Baseline Correction Line


  • Since point B is higher than the DRIFT setting line from point A and point C is lower, the baseline correction line is line A-C.
  • Since point D is lower than the DRIFT setting line from point C, the baseline correction line is line C-D.


Fig. B Vertical Partitioning

Fig. C Baseline Partitioning

(the DRIFT lines can be changed via the [Drift] setting.)

If forced tailing is used (starting after 2 minutes and clearing after 6 minutes), peak integration is performed as shown in Figure D. With forced tailing, peaks in other unspecified intervals are partitioned vertically, even if they have a tailed shape.

( forced tailing can be specified via the ON/OFF interval setting at [Tailing].)

These peak integration commands and parameter changes can be specified not just once, but many times using peak integration time programs.

(It is recommended that appropriate peak integration parameters be considered during method development.)

Fig. D Forced Tailing

• Using Manual Peak Integration

Ideally, the same peak integration parameters should be used to analyze data acquired under similar analytical conditions. However, in some cases the desired peak integration results cannot be obtained using these peak integration time programs or it is desirable to move the peak detection point of individual peaks. In such cases, the baseline correction line can be changed manually by setting peak integration parameters (or peak integration commands) for individual sets of data.
To distinguish it from setting peak integration parameters (or peak integration commands) for methods, it is referred to as manual peak integration.


Therefore, as described above, one of the factors that determine peak area reproducibility can be eliminated by paying careful attention to peak integration settings.

Supplement 1: Peak Integration Time Program


Assay Calculation on Anhydrous basis

                   Assay Calculation on Anhydrous basis


What happens if my sample solvent is stronger than my mobile phase?


What happens if my sample solvent is stronger than my mobile phase?


We do not recommend injecting in a stronger solvent because it usually results in peak distortion, broadening, poor sensitivity, and shortening of retention times.

This happens because some analytes will tend to travel too quickly through the column, instead of eluting in a symmetrical band.

If you absolutely must do this, keep the volume as small as possible and make sure the solvents are miscible.


Ideal injection volume vs column dimension


Ideal injection volume vs column dimension


Optimal injection volumes are directly related to the cylinder volume of your  column and are, therefore, dependent on the cross sectional area (A=π r2) and length (L) of your column.

Therefore you can estimate any adjustment from an existing method for injection volume. If you are converting to a different size ID (with the same packing material and length), just multiply your current volume by the ratio of the radius squared to determine the correct volume for your new method. Injection volumes, as well as optimal flow rates, are limited by the size of the column. Ideally, your sample volumes should be, for the different column id:

Column IDVolume (µL)
2.1 mm (30 -100 mm length)1-3
3.0-3.2 mm (50-150 mm length)2-12
4.6 mm (50-250 mm length)8-40
10 mm (50-250 mm length)40-100
21.2 mm (50-250 mm length)150-300
30 mm (50-250 mm length)300-700
50 mm (50-250 mm length)1000-2000

Larger volumes may be acceptable if peaks are still symmetrical. Earlier eluting peaks will exhibit broadening first if the volume is getting too large.

If the solvent in your sample is stronger than the mobile phase (starting ratio if using a gradient), you will need to use a smaller volume.

Likewise, if your sample solvent is weaker than the mobile phase, you may be able to use a larger volume.

What to do when backpressure increases?


What to do when backpressure increases?


An increase in back-pressure usually suggests either a guard or analytical column problem. To find exactly where the problem lies we suggest you remove the guard column (if you are using one) and replace the old cartridge with a new one.

If the original pressure is restored, you solved the problem.

If the pressure remains high, disconnect the analytical column from the system, backflush it (do NOT connect the column to the detector while doing so) and run a few column volumes of your mobile phase through the column.

If the problem still persists you may have some strongly retained contaminants in your column coming from your previous injections.
Run the appropriate restoration procedures, as suggested by the column manufacturer, and retest the column.

If the initial pressure is not restored you may have to change the inlet frit or replace the column.

Always run your system (2 to 5 ml/min) without the guard column and the analytical column to verify that your pressure isn’t coming from another source, like a blocked in-line column prefilter, blocked/kinked tubing, particulates blocking your injector etc.
Always work your way from the detector back to the pump to isolate the problem.


COVISHIELD™ Overview , You should know.....

  ChAdOx1 nCoV- 19 Corona Virus Vaccine (Recombinant) COVISHIELD™                                                                           ...

Most Popular Post