Released by - Mr. Govindkumar - REVERS PHASE & NORMAL PHASE HPLC, HPLC DETECTORS , ALL KINDS OF COLUMN DISCRIPTIONS , CONCEPT OF ANALYSIS , SYSTEM SUITABILITY CONCEPT , ICH GUIDLINES
*Recombinant, replication-deficient chimpanzee adenovirus vector encoding the SARS-CoV-2 Spike (S) glycoprotein.
Produced in genetically modified human embryonic kidney (HEK) 293 cells.
This product contains genetically modified organisms (GMOs).
Solution for injection
The solution is colourless to slightly brown, clear to slightly opaque and particle free with a pH of 6.6.
One dose (0.5 ml) contains:
Both COVISHIELD™ (manufactured by Serum Institute of India Pvt Ltd) and COVID-19 Vaccine AstraZeneca (manufactured
by AstraZeneca) are ChAdOx1 nCoV- 19 Corona Virus Vaccines (Recombinant).
4 CLINICAL PARTICULARS
What should you mention to your healthcare provider before you get Covishield vaccine? Tell the healthcare provider about all of your medical conditions, including:
* If you have ever had a severe allergic reaction (anaphylaxis) after any drug, food, any vaccine or any ingredients of COVISHIELD™ vaccine * If you have a fever * If you have a bleeding disorder or are on a blood thinner * If you are immunocompromised or are on a medicine that affects your immune system * If you are pregnant or plan to become pregnant * If you are breastfeeding * If you have received another Covid-19 vaccine, you should consult your healthcare provider before deciding to take the vaccine.
Who should get the Covishield vaccine? Covishield vaccine has been approved for restricted use in emergency situation in individuals 18 years of age and older.
Who should not get the Covishield vaccine? You should not get the Covishield vaccine if you: * Had a severe allergic reaction after a previous dose of this vaccine * Had a severe allergic reaction to any ingredient of this vaccine.
If you receive one dose of the Covishield vaccine, then the second dose should be administered between 4 to 6 weeks after the first dose. However, there is data available for administration of the second dose up to 12 weeks after the first dose from the overseas studies.
If you miss your second dose
If you forget to go back at the scheduled time, ask your healthcare provider for advice. It is important that you return for your second dose of Covishield vaccine.
Has the Covishield vaccine been used before? The Covishield™ is used in clinical trials, a number of participants received one or two doses in overseas and Indian trials.
What are the benefits of the Covishield vaccine? In ongoing clinical trials, the Covishield vaccine has been shown to prevent Covid-19 disease following 2 doses given between 4 and 12 weeks apart. The duration of protection against Covid-19 disease is currently unknown.
You may get protective immune response 4 weeks after the second dose of Covishield vaccine.
What are the risks of the Covishield vaccine? Side effects that have been reported with the Covishield vaccine include:
Very Common (may affect more than 1 in 10 people) * Tenderness, pain, warmth, redness, itching, swelling, or bruising where the injection is given * Generally feeling unwell * Feeling tired (fatigue) * Chills or feeling feverish * Headache * Feeling sick (nausea) * Joint pain or muscle ache
Common (may affect up to 1 in 10 people) * A lump at the injection site * Fever * Being sick (vomiting) * Flu-like symptoms, such as high temperature, sore throat, runny nose, cough and chills
Uncommon (may affect up to 1 in 100 people) * Feeling dizzy * Decreased appetite * Abdominal pain * Enlarged lymph nodes * Excessive sweating, itchy skin or rash
These may not be all the possible side effects of the Covishield vaccine. Serious and unexpected side effects may occur. Covishield vaccine is still being studied in clinical trials.
Your Question -
What protocol do you use to clean the RP C18 HPLC column daily?
I am running 30-50 samples/day I wonder if I need to do regular cleaning after use. My mobile phase 5% acetic acid-methanol-acetonitrile 70:15:15. What solvent do you suggest?
Answer -I usually make morning wash and night wash for column C18 RP, befor and after working in the end of the day.
The morning wash is consist of four stages; each stage about 10 minutes
1) 10% acetonitrile+90%water
2) 100% Methanol
3) 100% Acetonitrile
4) 100% mobile phase
The night wash is consist of four stagese too.
1) 10% acetonitrile+ 90% water
2) 100% Methanol
3) 100% Acetonitrile
4) 80% Acetonitrile+20% Water
This will longer the age of column what ever you work on the column.
YOUR QUESTION :-
How can you know that a sample is UV active?
Please update me- is there any specification on structure basis, that a compound is UV active?As a large molecule, can we make a decision to look into whether the structure of that molecule is UV active or inactive?
Answer -UV/Vis spectroscopy is routinely used in analytical chemistry for the quantitative determination of different analytes, such as transition metal ions, highly conjugated organic compounds, and biological macromolecules. Spectroscopic analysis is commonly carried out in solutions but solids and gases may also be studied.
• Solutions of transition metal ions can be colored (i.e., absorb visible light) because d electrons within the metal atoms can be excited from one electronic state to another. The colour of metal ion solutions is strongly affected by the presence of other species, such as certain anions or ligands. For instance, the colour of a dilute solution of copper sulfate is a very light blue; adding ammonia intensifies the colour and changes the wavelength of maximum absorption (λmax).
• Organic compounds, especially those with a high degree of conjugation, also absorb light in the UV or visible regions of the electromagnetic spectrum. The solvents for these determinations are often water for water-soluble compounds, or ethanol for organic-soluble compounds. (Organic solvents may have significant UV absorption; not all solvents are suitable for use in UV spectroscopy. Ethanol absorbs very weakly at most wavelengths.) Solvent polarity and pH can affect the absorption spectrum of an organic compound. Tyrosine, for example, increases in absorption maxima and molar extinction coefficient when pH increases from 6 to 13 or when solvent polarity decreases.
• While charge transfer complexes also give rise to colours, the colours are often too intense to be used for quantitative measurement.
almost all aromatic compounds are UV active and also compounds with double bonds with extended conjugation. Any basic book on spectroscopy can help you to know whether your molecule will be uv active or not.
Your Question :-
How to analyse UV inactive compound on HPLC using UV Detector?
In my research field I got UV inactive compound having one Chiral Center I want to separate the enantiomers on HPLC having UV detector So what can i do to get UV response on HPLC. ?
Answer -
I suggest to complex the compound with some kind of regents to give a color so you can detect in visible range. For the enantiomer you can modify a mobile phase containing 5% beta-cyclodextrine to enhance selectivity towards enentiomers.Derivatization is one way, but more laborious and expensive. You can try the more straightforward approach of indirect UV detection. The detection of a UV-Vis-transparent analyte is accomplished by adding light-absorbing species into the mobile phase. The presence of the analyte is monitored by measuring a decrease or The only way you could analyze a UV inactive compound on a UV detector is to derivatize it to add a UV active functionality, such as a phenyl ring. Otherwise you can't use UV on the compounds in their native state since there is nothing for the UV detector to detect. If you are doing this as a preparative LC than derivatization wouldn't be an option. Your only recourse would be to use another type of detector.
Your Question :-
Can Chloroform degrade C18 reverse phase Silica?
Answer - Chloroform will not damage your C18 RP column. I was hesitant before using it the first time, so I used a really old column that had been used with a lot of lipid-containing samples. The improvement after a {20% Ethanol or Methanol:water(ultra-pure) > 100% Methanol > 100% Acetonitrile > 100% Chloroform > 100% Acetonitrile > 100% Methanol > 20% Methanol:ultra-pure water} progression was very dramatic, restoring the column's theoretical plate number to close to that when it was new. This suggested that a lot of lipid had been accumulating on my column, impairing its performance and maybe introducing a 'lipid partition' into my separations. I have repeated this 'column-stripping' procedure several times since, on old columns that were losing resolution, and it does usually help, depending on the history of the column, and whether it has been used and stored within the limits set by the manufacturer.
I agree, however, that chloroform would not be appropriate in a mobile phase solvent for a Reverse-Phase column.
Thank you
Note - Drop your Question in Question box and also give your feedback about contents.
Q: I am familiar with the term ALCOA as it relates to data integrity, but lately, I have heard people refer to ALCOA+. Can you explain what impact this new acronym has on my company’s data integrity program?
ANSWER : - Before we get into the reason for the additions to ALCOA, referred to as ALCOA+, we should review what both of the acronyms mean. The acronym ALCOA requires data be attributable, legible, contemporaneous, original, and accurate. The acronym ALCOA+ adds the concepts that, in addition to ALCOA, data also needs to be complete, consistent, enduring, and available. It is important to understand what each element of ALCOA and ALCOA+ mean in order to apply the concepts appropriately with respect to a company’s records. The following are some general definitions, paraphrased from the Pharmaceutical Inspection Co-operation Scheme (PIC/S) (1), that can be used for understanding the elements of ALCOA and ALCOA+:
Attributable: The data generated or collected must be traceable back to the individual who generated the information.
Legible: The data recorded must be readable and permanent.
Contemporaneous: The results, measurements, etc. must be recorded at the time the work is performed.
Original: Original or source data are the record, report, notebook etc. where the data point was initially recorded.
Accurate: The data recorded must be complete, consistent, truthful, and representative of facts.
Complete: Information that is critical to recreating and understanding an event. This would include any repeat or reanalysis performed on a laboratory test sample.
Consistent: The data are presented, recorded, dated, or time-stamped in the expected and defined sequence.
Enduring: The data or information must be maintained, intact, and accessible throughout their defined retention period.
Available: The data or information must be able to be accessed at any time during the defined retention period.
Data integrity has always concerned regulatory authorities, but it is important to understand what is prompting the renewed discussion of ALCOA and the introduction of ALCOA+ when discussing data integrity issues. Many of the concepts for ALCOA have been captured in the regulations as far back as 1978. Since that time, the industry has changed dramatically. The generic-drug industry has grown and in the United States alone accounts for more than 80% of the prescriptions written today (2). Coupled with the emergence of biosimilars, virtual companies, contract manufacturing organizations, rapid advances in automation and information technology, and the globalization of the industry have resulted in reinterpretation of the attributes associated with maintaining the integrity of data throughout the product lifecycle, whether those data are generated from electronic, paper-based, or hybrid systems. In addition, there has been an increase in citations internationally by the FDA, European Medicines Agency (EMA), Medicines and Healthcare products Regulatory Agency (MHRA), World Health Organization (WHO), and other health authorities. These changes and increased violations have brought about a resurgence and need to reeducate the industry on the basic principles and concepts regarding the proper control of data used to support the quality and safety of medicines.
The ALCOA acronym has been used since the 1990s; however, the requirements governing data elements have been in regulations for a much longer period of time. EudraLex chapter 4 states, “Suitable controls should be implemented to ensure the accuracy, integrity, availability, and legibility of documents. Instruction documents should be free from errors and available in writing” (3). The US Code of Federal Regulations (CFR) refers to these elements in various sections of the regulations (4–8). An example for language speaking to the element of attributable is in 21 CFR 211.194(a)(7), which states, “The initials or signature of the person who performs each test and the date(s) the tests were performed.” Language in 21 CFR 58.130 (e) addresses the elements of contemporaneous and legible by stating, “All data generated during the conduct of a nonclinical laboratory study, except those that are generated by automated data collection systems, shall be recorded directly, promptly, and legibly in ink. All data entries shall be dated on the date of entry and signed or initialed by the person entering the data.”
Recent documents issued by WHO (9) and the PIC/S (1) have added to the original ALCOA attributes as indicated above. The PIC/S document actually states, “Some key concepts of GDocPs are summarized by the acronym ALCOA: Attributable, Legible, Contemporaneous, Original, and Accurate. The following attributes can be added to the list: Complete, Consistent, Enduring, and Available. Together, these expectations ensure that events are properly documented and the data can be used to support informed decisions.” WHO refers to ALCOA+ in the title of Appendix 1 to their 2018 document. The last two documents also address the concept of quality culture (10). The impact to your organization is that the quality culture must ensure that data supporting the quality and safety of your product must now meet the ALCOA+ elements in order to avoid regulatory citations for data integrity issues.
References
1. PIC/S, Draft Guidance: Good Practices for Data Management and Integrity in Regulated GMP/GDP Environments (PIC/S, August 2016). 2. statista.com 2019. 3. EC, EudraLex,The Rules Governing Medicinal Products in the European Union, Volume 4, Good Manufacturing Practice for Medicinal Products for Human and Veterinary Use, Chapter 4. 4. 21 CFR 11: Electronic Records; Electronic Signatures 5. 21 CFR 58: Good Laboratory Practice for Nonclinical Laboratory Studies 6. 21 CFR 211: Current Good Manufacturing Practice for Finished Pharmaceuticals 7. 21 CFR 212.50: Current Good Manufacturing for Positron Emission Tomography Drugs 8. 21 CFR 820: Quality System Regulation 9. WHO, Annex 5, Guidance on Good Data and Record Management Practices (WHO, June 2016). 10. S. Schniepp, Pharmaceutical Technology 42 (10) 2018.
Mobile phase has been rightly termed as the lifeline of the HPLC system. It plays the important role of transport of the sample through the separation column and subsequently to the detector for identification of the separated components.
Mobile phase is seldom a single solvent. It consists of combination of water with organic solvents, aqueous buffers with polar solvents or mixtures of organic solvents in desired proportions. The two operational modes commonly used are:
Isocratic mode – in the Isocratic mode the composition of the mobile phase remains constant throughout the analytical run ,i.e, the proportion of solvents in the mixture is pre-decided and remains unchanged during analysis
Gradient Elution – the composition is varied by the software through the analytical run in a predetermined mode and at the end of the run the proportion of solvents is different from the initial proportion.
The objective of using different solvent mixtures is to achieve the desired polarity of mobile phase for complete miscibility of the sample and control interaction of sample components with the stationary phase to achieve the desired degree of resolution of separated component peaks in the shortest possible time.
In order to meet the required objectives the mobile phase should have the following essential features:
The sample should be fully soluble in the mobile phase. Any insolubility will result in flow restrictions. Always check sample solubility in mobile phase before injection into the system.
Mobile phase components should be non-hazardous and non-toxic. They should not pose any health hazard to the operator.
Mobile phase shouId be inert towards sample constituents and the stationary phase. Any reactions can lead to formation of insoluble suspensions which can result in column blockages.
The mobile phase should not give its own response on passing through the detector. In other words the detector signals should reflect only the response of the sample constituents. This, however, is not applicable in bulk property detectors such as refractive index detector which respond to overall changes in refractive index of the mobile phase containing the eluting compound.
The mobile phase should be affordable and the proportion of solvents used should make the analysis economically viable.
It is important to mix the solvents of specified purity and from same source to get consistency of results and also to adopt the same off-line mixing technique to avoid errors due to heat of mixing errors. In case buffers are to be used always adjust the pH of the aqueous phase prior to making up the final volume with the organic phase.
HPLC technique holds great promise for applications in diverse fields. Control of operational conditions including consistency of mobile phase will ensure repeatability of results.
The mobile-phase pH can be a powerful tool to control retention and selectivity, but it can also get you in trouble if it is not controlled properly.
The adjustment of mobile-phase pH can be a powerful tool to obtain liquid chromatographic (LC) separations, but at the same time, poor control of the pH can be a source of serious problems with separations. In this installment of “LC Troubleshooting” I’d like to focus on mobile-phase pH and its role in retention and selectivity.
pH and Retention
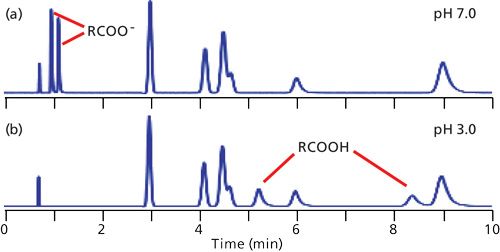
In reversed-phase LC, retention is dominated by the overall hydrophobic or nonpolar nature of the analytes. Compounds that are more polar tend to have shorter retention times than their nonpolar counterparts. As a result, the elution order of the typical chromatogram proceeds from polar to nonpolar compounds. If all the sample components are neutral, the mobile-phase pH generally can be ignored as an important factor in retention. This situation is observed in the chromatograms of Figure 1, where the unlabeled peaks eluted between approximately 3 and 9 min are neutral compounds. Notice that the retention of the neutrals is not altered with a change in pH from 7.0 (Figure 1a) to 3.0 (Figure 1b).
Figure 1: Simulated chromatograms for a mixture of six neutral compounds (unlabeled peaks between approximately 3 and 9 min) and two carboxylic acids at (a) pH 7.0 and (b) pH 3.0. The peak at approximately 0.75 min is t0.
When ionizable analytes are present, dramatic changes in retention can take place when the mobile-phase pH is altered. In Figure 1a, the carboxylic acid components are strongly ionized at pH 7.0, so their negative charge makes them more polar than the same molecules at pH 3.0 (Figure 1b). Thus we can see that pH can have a significant affect on retention of ionizable compounds.
I often cite my “Nothing’s Magic” rule, which says that, in general, we can assume a continuous change in the appearance of a chromatogram between two observed conditions and often can safely extrapolate somewhat beyond the observation points. In the current example, this rule suggests that between pH 7.0 and 3.0, the retention times of the acids will fall between those of Figures 1a and 1b.
Retention of Acids and Bases
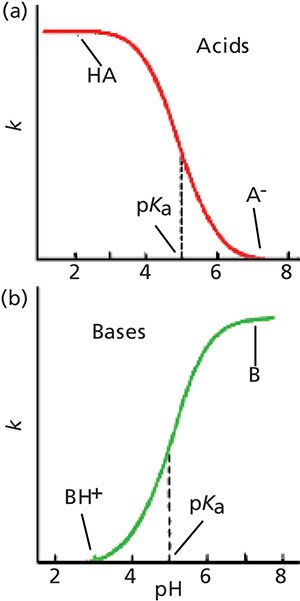
The changes in retention for acids and bases with a change in pH, not surprisingly, are in the opposite direction, as shown in Figure 2. In Figure 2a, we see that acids have good retention at low pH and poor retention at high pH, just as we observed in Figure 1. Just the opposite happens for bases (Figure 2b), because at high pH, bases are neutral and well retained, whereas at low pH they are ionized and poorly retained.
Figure 2: Generalized plots of retention versus mobile-phase pH for (a) acidic samples and (b) basic samples. These plots do not directly correspond to any of the example chromatograms, but rather show the general retention behavior of acids and bases as pH is changed.
At the midpoint of these curves is the pKa of the acid or base, where half of the molecules present are ionized and half are not ionized. Note that although both ionized and nonionized species are present at the pKa, only a single peak is observed. This occurs because the equilibrium between the two forms is so rapid compared to the time it takes for the sample to travel through the column that the analyte behaves chromatographically as the average of the molecules present. As the pH is shifted to a lower pH for acids, the portion of the total molecules present in the un-ionized form increases and the number of ionized molecules decreases, so the overall polarity of the acid decreases, resulting in longer retention times (moving left in Figure 2a). Bases have the opposite response to a change in pH.
Although the change in ionization is significant within approximately 1 pH unit of the pKa, you can see that the curves flatten out at both ends by the point the pH is 2 or more pH units above or below the pKa. It is generally considered that at 2 pH units from the pKa, an acid or base is fully ionized or ionization is fully suppressed. So the effect of a change in mobile-phase pH depends on the pH value compared to the pKa of a compound of interest. This means that if we want to use pH to adjust retention, this will be most effective within approximately 11.5 pH units of the pKa. On the other hand, for the most robust retention conditions, the mobile-phase pH should be >1.5 pH units from the compound’s pKa.
The Selectivity Power of pH
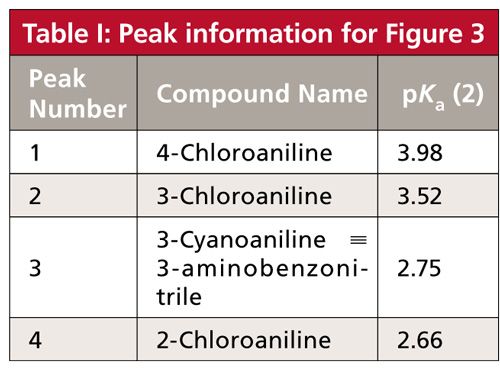
The real beauty of exploring mobile-phase pH during method development for samples that contain acids or bases is that the pH versus retention response curve varies somewhat from one compound to the next, especially if their pKa values differ. In practical terms, this means that significant changes in retention and peak spacing can be obtained with a change in mobile-phase pH. An example of this, as well as further elucidation of the generalized retention behavior of bases in Figure 2b, is shown in Figure 3 for separation of four substituted anilines (1). The peaks in Figure 3a are numbered and they are color-coded for all the peaks in Figure 3 for easier peak tracking. Analyte identities and pKa values for the peaks of Figure 3 are summarized in Table I. Note that the pKa values for these compounds vary from 2.66 to 3.98. The discussion above indicated that pH values within ±1.5 pH units of the pKa will be most effective at changing retention, so we’d expect to see the most peak movement in the pH range of (2.66–1.5) = 1.1 to (3.98 + 1.5) = 5.5. I have shown simulated chromatograms in Figure 3 of 2 ≤ pH ≤ 5.5; pH < 2 may cause column damage and pH > 5.5 showed almost no change from pH 5.5 for these analytes.
Figure 3: Simulated chromatograms for four substituted anilines at the pH values shown in the figure. Data of Table I of (reference 1), but adjusted for a 150 mm x 4.6 mm column size. Column type: StableBond CN column (Agilent); mobile phase: 25:75 buffer–methanol; buffer: 25 mM sodium citrate (pH ≥ 4.0) or potassium phosphate (pH < 4.0); flow rate: 1 mL/min; temperature: 35 °C. See Table I for compound identities and pKa values (2). The peak at ~1.7 min is t0.
Let’s track the movement of the various peaks and see how they are affected by pH. Peak 4 (black) with pKa = 2.66 will be ionized at pH 2.0, so it is least retained at this pH. As the pH is increased above pH 2.5, the nonionized species predominates and retention increases, as expected. By the point pH 4.0 is reached, ~1.5 pH units above the pKa, the ionization is suppressed (flat region to the right of Figure 2b), and little if any further change in retention is observed in the pH 4.0–5.5 chromatograms. Peak 3 (orange) has a similar pKa (2.75), so very similar behavior is seen for peaks 3 and 4, with stable retention above pH 4.0. Although the retention times of these two peaks change with pH, the selectivity, α, changes only a small amount (range of α = 1.36–1.40), so they nicely separated at all pH values shown. (Recall that α is the ratio of retention factors, k, for two adjacent peaks; in this case, α = k4/k3.)
We can similarly track peak 1 (green, pKa = 3.98) and peak 2 (red, pKa = 3.52). These peaks also move to higher retention times as the pH is increased and ionization subsequently is decreased. However, because the pKa values for peaks 1 and 2 are approximately 1 pH unit higher than those for peaks 3 and 4, the retention times do not stabilize until approximately 1 pH unit higher, as well, at pH 5.0 and above. Unfortunately, the selectivity between peaks 1 and 2 drops with increasing pH, from α = 1.64 at pH 2.0 to 1.05 at pH 5.5, so the separation of these peaks worsens with increased pH.
Mobile-Phase pH and Robustness
Many pharmaceutical laboratories are adopting the quality by design (QbD) guidelines (3) from the International Conference on Harmonization (ICH). These guidelines encourage establishing a design space that encompasses the boundaries of the process variable settings that provide acceptable quality. From a chromatographic standpoint, this means identifying the range that a chromatographic variable can be changed and will still provide acceptable analytical results. In the current context, this means performing robustness experiments to determine how much the mobile-phase pH can be varied and still provide adequate separation.
An example of a method with poor robustness to pH is shown in the chromatograms of Figure 4 for a sample of bile acids (4). In Figure 4a, all the peaks are separated to baseline at a mobile-phase pH of 5.1. However, when the pH is shifted to 5.2 (Figure 4b), the last two peaks merge into a poorly separated doublet (arrow). When a pH meter is used to measure the pH of a solution during pH adjustment, normal laboratory variation is typically ±0.05–0.1 pH units. When the pH of a buffer is adjusted by titration, differences such as those seen between Figures 4a and 4b would not be surprising when different batches of buffer were prepared. As a result, the separation would not be sufficiently robust if a mobile-phase pH value of 5.1 were specified.
Figure 4: Simulated separations of a sample of bile acids based on data of (reference 3). Mobile-phase pH: (a) 5.1, (b) 5.2.
Let’s consider how to establish satisfactory separation conditions for the sample of Figure 3 that have acceptable robustness. Generally, we like to have isocratic retention factors, k, of 2–10, but 1–20 usually is acceptable if 2–10 is not possible. Also, let’s specify that we want baseline resolution between peaks. In addition we would like a method that tolerates as much variation in pH as possible.
The separation at pH 2.0 in Figure 2a looks good, but the k-values for the first two peaks are <1, so there is a risk of interferences at the column dead time, t0, when real samples are run. At pH 2.5 (Figure 2b), k for the first peak is ~1, and plenty of separation is observed, so this pH is acceptable. At pH 3.0 (Figure 2c), peak 2 has moved partially past peak 3, and the separation is not adequate. At pH 2.75 (chromatogram not shown), peak 3 is just baseline separated after peak 2, so this is about the maximum acceptable pH; at all larger values of pH, peak merging is observed.
With acceptable separations seen over a range of 2.0 ≤ pH ≤ 2.75, we would probably set the default pH midway between these points-for example, at pH 2.35. During validation we could then run experiments at pH 2.05 and 2.65. If these conditions gave satisfactory separation (and other method performance requirements), we could define the method pH as 2.35 and allow adjustment of the pH by up to ±0.3 pH units. Such a statement in the method document would allow the analyst to adjust the pH by up to 0.3 pH units to achieve system suitability.
To ensure that the mobile phase is as stable as possible, we use a buffer in the mobile phase. Buffers are most effective ±1 pH unit from their pKa values. Phosphate has three pKa values, at 2.1, 7.2, and 12.3, so it would be an appropriate buffer to use in the pH 2.35 ± 0.3 range. Contrast this with acetate, with a pKa of 4.8, which would not be an appropriate buffer for the sample of Figure 3. On the other hand, if it were necessary to operate the method of Figure 4 at pH 5.1, acetate would be the right buffer to use, not phosphate. A buffer concentration of 20–30 mM is common for most LC methods, although concentrations as low as 5–10 mM are suitable with today’s high-purity silica columns.
Summary
Mobile-phase pH will have little effect on the retention of neutral compounds, but if ionizable compounds are present in a sample, pH control is necessary to stabilize retention. The pH of the mobile phase can be an extremely powerful tool to move peaks around in the chromatogram during method development, but the flip side is that it needs to be carefully controlled during routine analysis to maintain robust separation conditions. When selecting a buffer to control the mobile-phase pH, be sure to select one with a pKa value within 1 pH unit of the desired pH or it may not have enough buffering capacity to stabilize retention.