Released by - Mr. Govindkumar - REVERS PHASE & NORMAL PHASE HPLC, HPLC DETECTORS , ALL KINDS OF COLUMN DISCRIPTIONS , CONCEPT OF ANALYSIS , SYSTEM SUITABILITY CONCEPT , ICH GUIDLINES
Atthebeginningofachromatographicseparationthesoluteoccupiesanarrow bandoffinitewidth.Asthesolutepassesthroughthecolumn,thewidthofitsband continually increases in a process called band broadening. Column efficiency pro- vides a quantitative measure of the extent of band broadening.
wherethevariance,σ2,hasunitsofdistancesquared.Becauseretentiontimeand peakwidthareusuallymeasuredinsecondsorminutes,itismoreconvenienttoex- pressthestandarddeviationinunitsoftime,τ,bydividingbythemobilephase’s average linearvelocity.
Mobile phase has been rightly termed as the lifeline of theHPLCsystem. It plays the important role of transport of the sample through the separation column and subsequently to the detector for identification of the separated components.
Mobile phase is seldom a single solvent. It consists of combination of water with organic solvents, aqueous buffers with polar solvents or mixtures of organic solvents in desired proportions. The two operational modes commonly used are:
Isocratic mode – in the Isocratic mode the composition of the mobile phase remains constant throughout the analytical run ,i.e, the proportion of solvents in the mixture is pre-decided and remains unchanged during analysis
Gradient Elution – the composition is varied by the software through the analytical run in a predetermined mode and at the end of the run the proportion of solvents is different from the initial proportion.
The objective of using different solvent mixtures is to achieve the desired polarity of mobile phase for complete miscibility of the sample and control interaction of sample components with the stationary phase to achieve the desired degree of resolution of separated component peaks in the shortest possible time.
In order to meet the required objectives the mobile phase should have the following essential features:
The sample should be fully soluble in the mobile phase. Any insolubility will result in flow restrictions. Always check sample solubility in mobile phase before injection into the system.
Mobile phase components should be non-hazardous and non-toxic. They should not pose any health hazard to the operator.
Mobile phase shouId be inert towards sample constituents and the stationary phase. Any reactions can lead to formation of insoluble suspensions which can result in column blockages.
The mobile phase should not give its own response on passing through the detector. In other words the detector signals should reflect only the response of the sample constituents. This, however, is not applicable in bulk property detectors such as refractive index detector which respond to overall changes in refractive index of the mobile phase containing the eluting compound.
The mobile phase should be affordable and the proportion of solvents used should make the analysis economically viable.
It is important to mix the solvents of specified purity and from same source to get consistency of results and also to adopt the same off-line mixing technique to avoid errors due to heat of mixing errors. In case buffers are to be used always adjust the pH of the aqueous phase prior to making up the final volume with the organic phase.
HPLC technique holds great promise for applications in diverse fields. Control of operational conditions including consistency of mobile phase will ensure repeatability of results.
The Role of pH IN MOBILE PHASE -
The pH of the mobile phase (eluent) is adjusted to improve component separation and to extend the column life. This pH adjustment should involve not simply dripping in an acid or alkali but using buffer solutions, as much as possible. Good separation reproducibility (stability) may not be achieved if buffer solutions are not used.
A buffer solution is prepared as a combination of weak acids and their salts (sodium salts, etc.) or of weak alkalis and their salts. Common preparation methods include: 1) dripping an acid (or alkali) into an aqueous solution of a salt while measuring the pH with a pH meter and 2) making an aqueous solution of acid with the same concentration as the salt and mixing while measuring the pH with a pH meter. However, if the buffer solution is used as an HPLC mobile phase, even small errors in pH can lead to problems with separation reproducibility. Therefore, it is important to diligently inspect and calibrate any pH meter that is used. This page introduces a method that does not rely on a pH meter. The method involves weighing theoretically calculated fixed quantities of a salt and acid (or alkali) as shown in the table below. Consider the important points below.
Denoting Buffer Solutions
A buffer solution denoted, "100 mM phosphoric acid (sodium) buffer solution pH = 2.1," for example, contains phosphoric acid as the acid, sodium as the counterion, 100 mM total concentration of the phosphoric acid group, and a guaranteed buffer solution pH of 2.1.
Maximum Buffer Action Close to the Acid (or Alkali) pKa
When an acetic acid (sodium) buffer solution is prepared from 1:1 acetic acid and sodium acetate, for example, the buffer solution pH is approximately 4.7 (near the acetic acid pKa), and this is where the maximum buffer action can be obtained.
Buffer Capacity Increases as Concentration Increases
The buffer capacity of an acetic acid (sodium) buffer solution is larger at 100 mM concentration than at 10 mM, for example. However, precipitation occurs more readily at higher concentrations.
Beware of Salt Solubility and Precipitation
The salt solubility depends on the type of salt, such as potassium salt or sodium salt. Salts precipitate out more readily when an organic solvent is mixed in.
In addition, avoid using buffer solutions based on organic acids (carboxylic acid) as much as possible for highly sensitive analysis at short UV wavelengths. Consider the various analytical conditions and use an appropriate buffer solution, such as an organic acid with a hydroxyl group at the α position to restrict the effects of metal impurity ions
Differences in Preparation Method May Result in Different Chromatograms -
A water-based solvent, organic solvent, or a mixture of the two is mainly used as the mobile phase for HPLC. A buffer solution is often used as the aqueous solvent. describes the actual preparation methods for typical buffer solutions used with HPLC. However, it seems that many people have a vague understanding of buffer solutions.
If the preparation method is not the same as the method described in the material for the analysis method, differences can occur in the mobile phase that affect the chromatograms and analysis results. Apart from the buffer solution, many other unforeseen factors affect the mobile phase preparation, such as the method of mixing the solvent.
Here, we use actual examples to consider the effects of the mobile phase preparation method on the analysis results.
Preparing Buffer Solutions
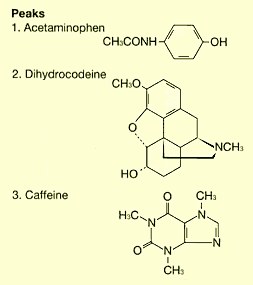
In practice, how do we go about preparing a buffer solution that is denoted as "20 mM phosphoric acid buffer solution (pH=2.5)"? Let's examine a few possible issues. First, we know that it is a phosphoric acid buffer solution, but what is the counterion? If sodium ions are unambiguously the counterion, does "20 mM" refer to the phosphoric acid concentration or the sodium phosphate concentration?
For a 20 mM phosphoric acid (sodium) buffer solution, "20 mM" could be considered to be the phosphoric acid concentration. On the other hand, considering "20 mM" to be the sodium concentration, the buffer solution could be a buffer solution prepared by adjusting the pH using a 20 mM aqueous solution of sodium dihydrogen phosphate. (However, a 20 mM aqueous solution of sodium dihydrogen phosphate has a pH just under 5, so that pH adjustment with some type of acid is required to achieve pH 2.5.) However, an ion-pair effect due to the acid used for pH adjustment could affect the analysis results. This is potentially dangerous, as it leads to several possible interpretations of a denoted buffer solution.
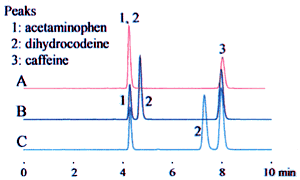
The example above leads to three potential interpretations. Fig. 1 shows how this affects the analysis results. These differences can significantly affect the retention time, as shown for dihydrocodeine in the example, and can lead to problems with the robustness of the analysis method. Clearly identifying the buffer solution when specifying the preparation method can prevent problems due to differences in interpretation.
Because of its nutritional, anti-oxidative, and cryoprotective properties, human serum albumin (HSA) is an important ingredient of the culture and cryopreservation media for assisted reproductive techniques (ART) such as in vitrofertilization (IVF) and intracytoplasmic sperm injection (ICSI) procedures. Several tools are available for the determination of this serum protein in biological samples and pharmaceutical preparations, including colorimetric, electrophoretic, and immunological assays. However, because of inter-assay variability and accuracy problems of the above-mentioned assays, we have chosen to develop and validate a reverse phase (RP) high-performance liquid chromatography (HPLC) method to assess HSA content in ART-related media. Briefly, a gradient elution (a combination of acetonitrile/water, supplemented with 0.1% (v/v) trifluoroacetic acid) was used to separate samples on a C4 (n-butyl-coated silica) column. Two main peaks were observed at 4.970 and 8.715 min, representing the stabilizer N-acetyl-tryptophan (N-Ac-Trp) and HSA respectively. Validation of the method demonstrated that HSA can be determined in an accurate and precise manner, in a range between 0.4 and 25 mg ml−1, without interference of matrix ingredients. The limit of detection (LOD) and lower limit of quantification (LLOQ) values were 0.128 and 0.386 mg ml−1, respectively. In summary, this RP-HPLC method serves as a quality control for ART product release and stability studies. If required, the method can be easily adapted for assessment of HSA in biological samples and pharmaceutical preparations.
The actual separation of each component in the sample is carried inside a column; however this separation needs to be "collected" for us to be able to see it. The detectors are used for this purpose. The separated coponents are monitored and expressed electronically. There is no universal detector that can monitor all compounds and there are many detectors used for LC analysis. Some are listed below.
Type
Common Abbreviation
Ultra Violet
UV
Visible
VIS
Photo Diode Array
PDA
Refractive Index
RI
Evaporative Light Scattering
ELS
Multi Angle Light Scattering
MALS
Mass Spectrometer
MS
Conductivity
CD
Fluorescence
FL
Chemiluminescence
CL
Optical Rotation
OR
Electro Chemical
EC
1. UV, VIS, and PDA Detectors
The UV, VIS, and PDA detectors are categorized as absorbance detectors. They provide good sensitivity for light-absorbing compounds at ~pg level. They are easy to operate and provide good stability. UV detector is a very commonly used detector for HPLC analysis. During the analysis, sample goes through a clear color-less glass cell, called flow cell. When UV light is irradiated on the flow cell, sample absorbs a part of UV light. Thus, the intensity of UV light observed for the mobile phase (without sample) and the eluent containing sample will differ. By measuring this difference, the amount of sample can be determined. Since the UV absorbance also differs depend on what wavelength is used, it is important to choose an appropriate wavelength based on the type of analyte. A standard UV detector allows user to choose wavelength between 195 to 370 nm. Most commonly used is 254 nm. Compared to a UV detector, a VIS detector uses longer wavelength (400 to 700 nm). There are detectors that provide wider wavelength selection, covering both UV and VIS ranges (195 to 700 nm) called UV/VIS detector. PDA detects an entire spectrum simultaneously. UV and VIS detectors visualize the obtained result in two dimensions (light intensity and time), but PDA adds the third dimension (wavelength). This is convenient to determine the most suitable wavelength without repeating analyses.
2. Refractive-Index Detector
Figure 1
RI detector measures change in reflex index. A glass cell is divided into two chambers (cells). The effluent from LC column flow through the "sample cell", while other cell called "reference cell" is filled with only mobile phase. When the effluent going through the sample cell does not contain any analyte, the solvent inside both cells are the same (Figure 1A). When a beam is irradiate on the cells, the observed beam will be straight in this case. However, in a case the effluent contains any components other than mobile phase; bending of the incident beam occurs due to the reflex index difference between the two solvents (Figure 1B). By measuring this change, the presence of components can be observed. RI detector has lower sensitivity compared to UV detector, and that's the main reason why RI is not as commonly used as UV. However there are some advantages over UV detector.
It is suitable for detecting all components. For an example, samples which do not have UV absorption, such as sugar, alcohol, or inorganic ions obviously cannot be measured by a UV detector. In contrast, change in reflective index occurs for all analyte, thus a RI detector can be used to measure all analyte.
It is applicable for the use with solvent that has UV absorbance. A UV detector cannot be used with solvent which has UV absorbance. Sometimes the organic solvent used for GPC analysis absorbs UV, and thus UV detector cannot be used.
It provides a direct relationship between the intensity and analyte concentration. The amount of UV absorbed depends on each analyte, thus the intensity of UV detector peak does not provide information on the analyte concentration. While intensity observed by a RI detector is comparable to the concentration of analyte. Because of those advantages, RI is often used for the detection of sugars and for SEC analysis.
3. Evaporative Light Scattering Detector ELSD provides good sensitivity for non-volatile analytes at ng level. The column effluent is nebulized and then evaporated to make it form fine particles. The analyte is then radiated with a laser beam and the scattered radiation is detected. The target sample includes lipids, sugar, and high molecular weight analytes. It is used in the similar way as a RI detector, but can provide more sensitive detection with stable base line. Another advantage is that ELSD can be used for the gradient method whereas RI cannot.
4. Multi-Angle Light Scattering Detector For the SEC analysis, MW of analyte is estimated from the calibration curve drown using a set of known standards. However, by using a MALS, MW can be determined directly without the need of calibration curve. Also MALS can provide an absolute MW of the analyte with very low detection limit.
5. Mass Spectrometer The analytes are detected based on their MW. The obtained information is especially useful for compound structure identification. However, its use is not limited to structure identification and can be used to quantify very low detection limit of elemental and molecular components.
6. Conductivity Detector Solutions containing ionic components will conduct electricity. Conductivity detector measures electronic resistance and measured value is directly proportional to the concentration of ions present in the solution. Thus it is generally used for ion chromatography.
7. Fluorescence Detector The advantage of fluorescence method is its high sensitivity for selective groups of compounds at ~fg level. By using a specific wavelength, analyte atoms are excited and then emit light signal (fluorescence). The intensity of this emitted light is monitored to quantify the analyte concentration. Most pharmaceuticals, natural products, clinical samples, and petroleum products have fluorescent absorbance. For some compounds which do not have fluorescence absorbance or low absorbance, they can be treated with fluorescence derivatives such as dansylchloride. The system is easy to operate and relatively stable.
8. Chemiluminescence Detector Similar to FL, but instead of using a light source to excite the analyte atoms, the excitation is initiated by chemical reaction. Since it is not relied on the external excitation source, the noise is small, results in high signal to noise ratio, i.e. it provides even higher sensitivity than FL.
9. Optical Rotation Detector Specific for the optical isomer measurement. The column can separate R- and L- type optical isomers, but the general detectors (e.g., UV) cannot distinguish which is R nor L. OR detector provides this information.
10. Electro Chemical Detector There are several different types of ECs. The detection is based on amperometry, polarography, coulometry, and conductrometry. They offer high sensitivity, simplicity, convenience, and wide-spread applicability. It is especially suitable for the use with semi-micro or capillary type system.