Column Efficiency Calculation , Analytical Wavelength

Methods for Describing Column Efficiency

There are two related terms used as quantitative measures of chromatographic efficiency:

  • Number of ‘theoretical plates’ N
  • Plate height H.

These parameters are used to measure a column’s resolving power (ability to differentiate between closely migrating peaks - sometimes called efficiency). The two parameters are related by the following equation:

N equals L divided by H

where L is the length of the column packing (usually in cm - this is a constant for a given column).

The term theoretical plates refers to an early explanation of the resolving power of a column where the column was viewed as a ‘stack’ of closely related but discrete layers (or plates). The more plates in the column the greater the resolving power of the column but as the column has a definite length, more plates equals thinner plates. In other words and H are inversely proportional. As N increases (for a given column) H decreases.

There are great differences in the plate height and numbers of theoretical plates between columns due to differences in the column type as well as the stationary and mobile phases used.

Thus variations of the following magnitudes exist:

Plate height:0.1 to 0.001 mm or smaller
Plate numbers:100 to 100 000

There are a number of complex methods for determining N but a simple approximation of N is given by:

N equals 5.54 times (tg divided by W over 2) squared.

where W/2 = half of the width of the peak at its base, which is also equal to the width of the peak at half its maximum height and tg = retention time (time taken for the peak to come off the column) of the analyte.

A peak on chromatogram showing a vertical line through the top of the peak and a horizontal line accross the peak at its base. The W/2 label on the chromatogram represents half of the base width.

Sample problem:
Calculate the number of theoretical plates N and the plate height H, when the retention time is 20.40 minutes, half of the base width (given in minutes) is 0.65 minutes and the column length is 30 cm.

Solution
N equals 5.54 times (tg divided by W over 2) squared, which equals 5.54 times (20.40 divided by 0.65) squared, which equals 5.54 times (31.38) squared, which equals 5.54 times 984.70 which equals 5455 plates.

N equals L divided by H, so H equals L divided by N, which equals 30 cm divided by 5455 which equals 0.05 mm.

Practical application of N
N is usually used to measure and verify the performance of a column.
Measurement of N can be used to:

  • measure the resolving power of a column
  • measure that the resolving power of a new column is to specification
  • monitor the resolving power of a column over time
  • determine if column replacement is required due to deterioration in performance
  • troubleshoot problems.

The number of theoretical plates n, is the number of discrete distillations that would have to be performed to obtain an equivalent separation.

Gas chromatography columns normally have 103 to 106 theoretical plates.

The number of theoretical plates is related to the retention time, tr, and the width of the peak containing the compound.

If the peaks are reasonably symmetric, it can be assumed that they have a Gaussian shape. Then

n=5.54(trw12)2

where w12 is the peak width at half-height

You find the peak width at half height by drawing a line vertically from the peak maximum to the baseline, measuring half-way up the peak, drawing a horizontal line, and measuring the length of the horizontal line.

You measure the retention time (designated avove as Ve for elution volume) at the point where the vertical line drawn through the maximum intersects the baseline.

Both tr and w12 must be measured in the same units.

other hand-----

EXAMPLE

A chromatogram from a certain column has a peak with a w12 of 12 mm and a tr of 650 mm as measured on the chart. What is the number of theoretical plates?

Solution

n=5.54(trw12)2=5.54(650mm12mm)2=16 250 theoretical plates


Analytical Wavelength

The analytical wavelength for quantitative analysis is normally lamdamax ie the wavelength corresponding to an absorption peak.

Absorption spectra with one peak

There are several reasons for this choice.

Absorbance per unit concentration of analyte is greatest at lambdamax - this provides maximum sensitivity. That is to say, the higher the absorbance, the lower the concentration that the analysis is able to reliably measure.

Consider the comparison (below) of using the analytical wavelength at lambdamax and at half lambdamax - the analyte concentration is some value called ‘x’. If absorbances cannot be read below 0.1 because of the potential for substantial error, you can see in this example that lambdamax enables the analyte concentration to be determined down to at least x/8 whereas this concentration falls below the 0.1 absorbance threshold at half lambdamax. The higher the absorbance per unit of concentration (highest at lambdamax), the more sensitive the analysis.

Analytical wavelength at lambda max and at half lambda max

The absorbance curve is normally flat (or plateaus out) around lambdamax and this circumstance leads to optimum precision and accuracy. There can be some spectrophotometer error in the setting of lambdamax but without there being significant change in the value of the absorbance. On the other hand, if the analytical wavelength is selected from a point on the side of a peak, the same error in wavelength setting can have a significant impact on absorbance. Error in the wavelength setting of a spectrophotometer translates to imprecision/inaccuracy in the calculated concentrations.
A peak on a spectrum showing that variation in wavelength setting leads to relatively small errors in absorbance at lambda max compared to much larger errors at wavelength settings on the shoulder of the peak.

WATER HARDNESS , CHLORIDE & CALCULATION

                                WATER 

HARDNESS & CHLORIDE                                                    CALCULATION                                                                                                                                                                                                

PROCEDURE -

Take 50 ml of the sample in to clean & dry conical flask. Add some quantity of Eriochrome Black T as an indicator & shake well this solution . Add 1 ml of Ammonium Buffer solution , shake well & finally titrate the above solution with standard 0.02 N EDTA solution .


End Point : Wine red to Sky blue.


Calculations :        

                             B. R. X 1000               X 1000

Total Hardness (ppm) =    -------------------  =    --------------= ___ ppm

                                 V                       50

 Where,        

 B.R.  =  Volume in ml of the EDTA standard solution used in titration.

 V       =  Volume in ml of the sample taken for the test.


CHLORIDE CONTENT -

Procedure :-

Take 50 ml of the water sample & transfer into the conical flask . Titrate with standard 0.1 N Silver nitrate ( AgNO3 ) solution using Potassium Chromate as an indicator.


End Point :  Yellow to Brick Red ppt.

Calculations :

                              V1 X N (AgNO3) X 35450

Chloride content (ppm) =  --------------------------------------

                                 V2

 Where,       

 V1   =  Volume in ml of AgNO3 used by sample.

 V2   =  Volume in ml of the sample taken for the test.


What is "Hard Water"?

Perhaps you have on occassion noticed mineral deposits on your cooking dishes, or rings of insoluble soap scum in your bathtub. These are not signs of poor housekeeping, but are rather signs of hard water from the municipal water supply. Hard water is water that contains cations with a charge of +2, especially Ca2+ and Mg2+. These ions do not pose any health threat, but they can engage in reactions that leave insoluble mineral deposits. These deposits can make hard water unsuitable for many uses, and so a variety of means have been developed to "soften" hard water; i.e.,remove the calcium and magnesium ions.

Problems with Hard Water

Mineral deposits are formed by ionic reactions resulting in the formation of an insoluble precipitate. For example, when hard water is heated, Ca2+ ions react with bicarbonate (HCO3-) ions to form insoluble calcium carbonate (CaCO3), 


Some Strategies to "Soften" Hard WaterThis precipitate, known as scale, coats the vessels in which the water is heated, producing the mineral deposits on your cooking dishes. In small quantities, these deposits are not harmful, but they may be frustrating to try to clean. As these deposits build up, however, they reduce the efficiency of heat transfer, so food may not cook as evenly or quickly in pans with large scale deposits. More serious is the situation in which industrial-sized water boilers become coated with scale: the cost in heat-transfer efficiency can have a dramatic effect on your power bill! Furthermore, scale can accumulate on the inside of appliances, such as dishwashers, and pipes. As scale builds up, water flow is impeded, and hence appliance parts and pipes must be replaced more often than if Ca2+ and Mg2+ ions were not present in the water.

For large-scale municipal operations, a process known as the "lime-soda process" is used to remove Ca2+ and Mg2+ from the water supply. Ion-exchange reactions, similar to those you performed in this experiment, which result in the formation of an insoluble precipitate, are the basis of this process. The water is treated with a combination of slaked lime, Ca(OH)2, and soda ash, Na2CO3. Calcium precipitates as CaCO3, and magnesium precipitates as Mg(OH)2. These solids can be collected, thus removing the scale-forming cations from the water supply.

To see this process in more detail, let us consider the reaction for the precipitation of Mg(OH)2. Consultation of the solubility guidelines in the experiment reveals that the Ca(OH)2 of slaked lime is moderately soluble in water. Hence, it can dissociate in water to give one Ca2+ ion and two OH- ions for each unit of Ca(OH)2 that dissolves. The OH- ions react with Mg2+ ions in the water to form the insoluble precipitate. The Ca2+ ions are unaffected by this reaction, and so we do not include them in the net ionic reaction (Equation 2). They are removed by the separate reaction with CO32- ions from the soda ash.

 Household water softeners typically use a different process, known as ion exchange. Ion-exchange devices consist of a bed of plastic (polymer) beads covalently bound to anion groups, such as -COO-. The negative charge of these anions is balanced by Na+ cations attached to them. When water containing Ca2+ and Mg2+ is passed through the ion exchanger, the Ca2+ and Mg2+ ions are more attracted to the anion groups than the Na+ ions. Hence, they replace the Na+ ions on the beads, and so the Na+ ions (which do not form scale) go into the water in their place.

CHLORIDE---

Increased salinization and chloride concentrations can induce a variety of ecological effects within both aquatic and terrestrial ecosystems. It can lead to the acidification of streams, mobilize toxic metals from soils through ion exchange, affect mortality and reproduction of aquatic plants and animals, alter community composition of plants in riparian areas and wetlands, facilitate the invasion of saltwater species into previously freshwater ecosystems, and interfere with the natural mixing of lakes. At relatively low concentrations, salt has also been shown to alter the structure of microbial communities. It can also inhibit the process of denitrification, a microbial process critical for removing nitrate and maintaining water quality, in inland waters that are receiving inputs of salt for the first time. Previous work has also shown that increased chloride can inhibit nitrification and respiration of organic matter. Undesirable effects of increasing salinity to particular taxa may directly and indirectly influence broader ecosystem processes in inland waters related to primary productivity, decomposition, nutrient spiraling and cycling, nutrient recycling in lakes because of changes in mixing regime, and the trophic complexity of food webs. The effects of salinization on these ecosystem level properties in inland water are surprisingly less known in both arid and humid environments, but are under current investigation.

In addition to the consistently elevated concentrations of chloride, extreme fluctuations in concentrations of chloride over intraannual periods due to drought or deicer inputs may also provide a harsh environment for many freshwater organisms and disrupt ecosystem functions. Drought may concentrate salt concentrations in groundwater and surface waters. The runoff of salts and other deicing compounds containing chloride applied to roads can also undergo large seasonal fluctuations and large variations preceding and following the snow events . Fluctuations in chloride concentrations may have compounded effects on biota in addition to elevated concentrations because of difficulties in regulation of osmotic balance. Previous work has documented changes in fish assemblages in prairie streams, where variations in salinity are greatest. Previous work has also shown that monovalent Cl is more toxic to aquatic animals than to other forms, and minimum tolerance by organisms decreases as fluctuations in its concentration increase. Salt toxicity is directly related to water temperature, and its effects may be pronounced in suburban and urban streams receiving warm runoff from pavements or in arid environments experiencing a greater intensity and frequency of warmer temperatures.


Effects of Chloride Concentration on the Water Disinfection Performance of Silver Containing Nanocellulose-based Composites


The availability of microbially-safe drinking water is a challenge in many developing regions. Due to the well-known antibacterial effect of silver ions, materials used for their controlled release have been widely studied for point-of-use water disinfection. However, even if it is in principle known that chloride anions can suppress the antibacterial efficiency of silver, the majority of previous studies, surprisingly, have not focused on chloride concentrations relevant for freshwaters and thus for practical applications. Here, we prepared low-cost nanocellulose-aluminium oxyhydroxide nanocomposites functionalized with silver nanoparticles. Field samples obtained from Chennai, India were used as a guideline for choosing relevant chloride concentrations for the antibacterial studies, i.e., 10, 90, and 290 ppm. The antibacterial performance of the material against Escherichia coli and Bacillus subtilis was demonstrated and the influence of chloride concentration on the antibacterial effect was studied with E. coli. A 1 h contact time led to bacterial reductions of 5.6 log10, 2.9 log10, and 2.2 log10, respectively. This indicates that an increase of chloride concentration leads to a substantial reduction of antibacterial efficiency, even within chloride concentrations found in freshwaters. This work enables further insights for designing freshwater purification systems that utilize silver-releasing materials.

Waterborne diseases ----

Waterborne diseases caused by micro-organisms are a major cause of death worldwide and a grand challenge remains to find sustainable solutions for their control and elimination. The need for affordable, efficient, eco-friendly, and easily applicable technologies for removing micro-organisms is urgent. Point-of-use (POU) water treatment is often used when drinking water is retrieved from untreated natural sources where centralized water treatment facilities are not available. Chlorine treatment is a generic method for household water disinfection, but the formation of toxic byproducts makes it problematic, resulting in a need for alternative methods. Nanotechnology and especially nanoparticles have been studied as a possible solution to challenges related to water disinfection. The use of silver as an antibacterial agent dates back already to the first century BC. Nowadays, nanosilver is used in a variety of consumer products and these products are generally based on silver nanoparticles (AgNPs) that can be produced by chemical reduction of silver salts. Several different materials containing silver in its colloidal form, particularly nanoparticles, have been studied for POU water treatment. Chitosan cryogels, cellulosic material such as paper filters, alginate beads, ceramic cubes and filters, poly (sodium acrylate) cryogels, and cotton textiles loaded with AgNPs have been demonstrated for POU water treatment. However, research in the field still involves subtleties of e.g. controlling the concentration of released silver ions and the economic feasibility of the materials.

A low-cost material based on chitosan and aluminium oxyhydroxide embedded with AgNPs has previously been developed for a gravity-driven filtration unit. Inspired by that work, and to improve the economic feasibility of the product, we synthesized and characterized a composite material comprising of commercially available cationic cellulose nanofibrils (cCNF) and aluminium oxyhydroxide, which can retain AgNPs. Nanocellulose, including cellulose nanofibrils (CNF), is a renewable high strength nanoscopic material with interesting properties such as relatively high aspect ratio and broad range of easily applicable chemical modifications20, making it, e.g., an attractive reinforcing component for nanocomposites. CNFs are commonly prepared by mechanical treatments combined with chemical treatments and the resulting nanofibrils have lateral dimension in the order of 5–50 nm, depending on the source and preparation method. The chemical modification results in functionalization of the fibril, as for example in this work, with cationic quaternary ammonium groups. Importantly, cCNF was chosen as the starting material instead of unmodified CNF due to its inherent antibacterial properties, thus further promoting the intended function of the composite material. The fabricated materials act as carriers for the AgNPs and release Ag+ when brought into contact with water.

The mechanism of action of AgNPs for causing antibacterial effect is not yet fully understood. However, there is consensus that the oxidation of metallic silver to silver ions (Ag+) is required for achieving an antibacterial effect, although nanoparticle-specific effects have also been considered as one cause of toxicity AgNPs have been shown to be non-toxic to Escherichia coli when conducting tests under strictly anaerobic conditions, where Ag+ release is precluded, thus suggesting that antibacterial activity of AgNPs would solely be due to Ag+ release. Factors affecting the release kinetics of Ag+ from AgNPs include size of particles, temperature, shape, the surface ligand, and the composition of the surrounding medium.

Silver ions can form complexes with different anions commonly present in freshwaters, thereby reducing the amount of free Ag+ in water. Chloride concentration ([Cl]) has been recognized as a significant factor decreasing the antibacterial performance of silver ions due to the low solubility product of AgCl. In addition, complexation with e.g. sulfide and organic matter in freshwaters can result in decrease of free Ag+ concentration. In freshwaters, [Cl] can vary significantly. Still, this factor has not been properly considered when investigating the efficiency of silver-releasing materials for POU water purification. An objective of this study was first to screen realistic chloride concentrations relevant for applications and then to explore the effect of salinity in simulated freshwaters and more specifically, [Cl], on the antibacterial effect of the composites on Escherichia coli, a bacterium typically used as a biological indicator of drinking water safety. Bacillus subtilis was also used as a reference for a gram-positive model bacterium.

Unfortunately, the antibacterial tests of silver-releasing materials in laboratory conditions are often conducted in solutions with [Cl] irrelevant to freshwaters in rural areas. The tests are often performed in very low [Cl], such as highly diluted buffer solution or deionized water, or very high [Cl] such as undiluted PBS buffer where [Cl] is typically around 5000 ppm. When silver concentration is high, charged silver polychloride complexes are formed, which can contribute to the antibacterial activity. Additionally, several studies where the influence of [Cl] on AgNP toxicity has been considered, do not use [Cl] occurring in freshwaters as a basis for choosing the studied conditions, resulting in studies with low concentrations such as 12.5 ppm and high concentrations such as around 5000 ppm. Therefore, the fact that [Cl] can vary significantly in freshwater sources and that this can affect silver-based water disinfection is the main issue we highlight in this work.

In this work, we used simulated freshwaters with [Cl] in the range relevant to possible rural drinking water sources. Two different contact times (1 h and 2 h) between the composite and water were used. First, the antibacterial activity against E. coli and B. subtilis was compared and tests were continued with E. coli to study the influence of [Cl] on the antibacterial activity. Silver release from the composite as a function of time was also studied. Finally, based on our observations, we give an evaluation of the potential of the composites for use in water disinfection.


HPLC GRAPH PEAK INTEGRATION GUIDLINS & METHOD

 HPLC GRAPH PEAK INTEGRATION GUIDLINS & METHOD

Where do you start checking when reproducibility is poor for peak areas or quantitation values? Should you suspect a pump delivery malfunction or auto injector injection malfunction and start inspecting the equipment?
No, just wait a minute. First, investigate whether chromatogram peaks are being integrated properly and the baseline correction line is appropriate. A slight difference in peak integration parameters can make a big difference. In fact, by reviewing the data a little, it may be possible to avoid the trouble of acquiring data again.

1. Eliminating Noise and Other Unwanted Peaks

Width Value and Peak Detection

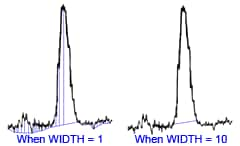
In some cases, peaks are not integrated correctly because target peaks contain noise. In such cases, verify that the peak integration parameters (or peak integration commands) in the method (analytical file) used to analyze data are appropriate. In some cases, the way the peak is detected can be changed by changing the width setting, as shown on the right.

FWHM

Normally, unwanted noise or other peaks can be eliminated by setting [WIDTH] (units: seconds) greater than the full width at half maximum (FWHM) of the unwanted peaks or setting [SLOPE] (units: µV/sec) greater than the leading slope of the unwanted peaks.

Slope of Peaks

Note: Rather than changing the peak integration parameters for each set of data, set those parameters when developing a method so that peaks can be integrated using the same peak integration parameters for all data measured under the same analytical conditions.

2. Integration of Unseparated Peaks

• Using Time Programs

[Integration Time Program]

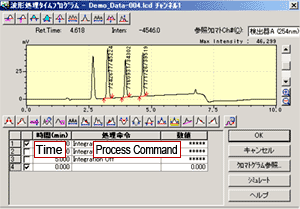
Even if appropriate integration is not possible using regular peak integration parameters, appropriate integration may be possible using a time program that specifies integration at specific times ([Integration Time Program] 

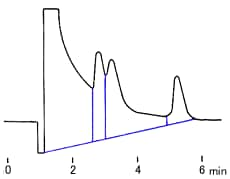
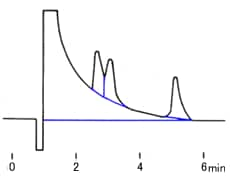
Figures A through D show how the method used to integrate peaks in the same chromatogram can have a large effect on area values.
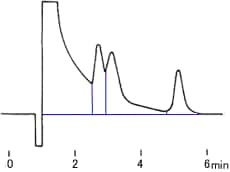
In Figure A, a baseline correction line is drawn from an unwanted negative peak, so that calculated peak areas are excessively large. If the [Negative Peak Reject] is specified in the time program (starting after 0.5 minutes and clearing after 2 minutes), the effects of negative peaks are eliminated, as shown in Figure B.

( negative peaks can be rejected by specifying
[Negative Peak Reject]

Fig. A Without Rejecting Unwanted Negative Peaks

Next, changing the [Drift] setting (see figure below) allows selecting either vertical partitioning (Fig. B) or baseline partitioning (Fig. C).

Relationship Between the DRIFT Setting Lines and Baseline Correction Line


  • Since point B is higher than the DRIFT setting line from point A and point C is lower, the baseline correction line is line A-C.
  • Since point D is lower than the DRIFT setting line from point C, the baseline correction line is line C-D.


Fig. B Vertical Partitioning

Fig. C Baseline Partitioning

(the DRIFT lines can be changed via the [Drift] setting.)

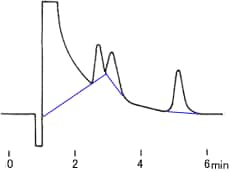
If forced tailing is used (starting after 2 minutes and clearing after 6 minutes), peak integration is performed as shown in Figure D. With forced tailing, peaks in other unspecified intervals are partitioned vertically, even if they have a tailed shape.

( forced tailing can be specified via the ON/OFF interval setting at [Tailing].)

These peak integration commands and parameter changes can be specified not just once, but many times using peak integration time programs.

(It is recommended that appropriate peak integration parameters be considered during method development.)

Fig. D Forced Tailing

• Using Manual Peak Integration

Ideally, the same peak integration parameters should be used to analyze data acquired under similar analytical conditions. However, in some cases the desired peak integration results cannot be obtained using these peak integration time programs or it is desirable to move the peak detection point of individual peaks. In such cases, the baseline correction line can be changed manually by setting peak integration parameters (or peak integration commands) for individual sets of data.
To distinguish it from setting peak integration parameters (or peak integration commands) for methods, it is referred to as manual peak integration.


Therefore, as described above, one of the factors that determine peak area reproducibility can be eliminated by paying careful attention to peak integration settings.

Supplement 1: Peak Integration Time Program


COVISHIELD™ Overview , You should know.....

  ChAdOx1 nCoV- 19 Corona Virus Vaccine (Recombinant) COVISHIELD™                                                                           ...

Most Popular Post