HPLC PARAMETER FOR ANALYSIS OF PROTEINS IN HUMAN SERUM


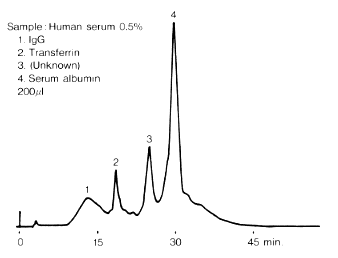
 Proteins in Human serum were analyzed using IEC QA-825 ( a column for strong anion exchange chromatography ).

In this analysis, the sample was separated into four peaks including the transferrin peak; the largest one is serum albumin.


Sample : Human serum
1. IgG
2. Transferrin
3. (Unknown)
4. Serum albumin

Column       : Shodex IEC QA-825 (8.0mmI.D. x 75mm)
Eluent       : (A); 20mM Tris-HCl buffer(pH8.6)
               (B); (A) + 0.5M NaCl
               Linear gradient: 0min to 60min, 100% (A) to 50% (B)
Flow rate    : 1.0mL/min
Detector     : UV(280nm)
Column temp. : Room temp.

Because of its nutritional, anti-oxidative, and cryoprotective properties, human serum albumin (HSA) is an important ingredient of the culture and cryopreservation media for assisted reproductive techniques (ART) such as in vitrofertilization (IVF) and intracytoplasmic sperm injection (ICSI) procedures. Several tools are available for the determination of this serum protein in biological samples and pharmaceutical preparations, including colorimetric, electrophoretic, and immunological assays. However, because of inter-assay variability and accuracy problems of the above-mentioned assays, we have chosen to develop and validate a reverse phase (RP) high-performance liquid chromatography (HPLC) method to assess HSA content in ART-related media. Briefly, a gradient elution (a combination of acetonitrile/water, supplemented with 0.1% (v/v) trifluoroacetic acid) was used to separate samples on a C4 (n-butyl-coated silica) column. Two main peaks were observed at 4.970 and 8.715 min, representing the stabilizer N-acetyl-tryptophan (N-Ac-Trp) and HSA respectively. Validation of the method demonstrated that HSA can be determined in an accurate and precise manner, in a range between 0.4 and 25 mg ml−1, without interference of matrix ingredients. The limit of detection (LOD) and lower limit of quantification (LLOQ) values were 0.128 and 0.386 mg ml−1, respectively. In summary, this RP-HPLC method serves as a quality control for ART product release and stability studies. If required, the method can be easily adapted for assessment of HSA in biological samples and pharmaceutical preparations.

Graphical abstract: Development and validation of a high-performance liquid chromatography (HPLC) method for the determination of human serum albumin (HSA) in medical devices

HPLC DETECTORS


                                                       HPLC DETECTORS

 The actual separation of each component in the sample is carried inside a column; however this separation needs to be "collected" for us to be able to see it. The detectors are used for this purpose. The separated coponents are monitored and expressed electronically. There is no universal detector that can monitor all compounds and there are many detectors used for LC analysis. Some are listed below.


Type

Common Abbreviation

Ultra Violet

UV

Visible

VIS

Photo Diode Array

PDA

Refractive Index

RI

Evaporative Light Scattering

ELS

Multi Angle Light Scattering

MALS

Mass Spectrometer

MS

Conductivity

CD

Fluorescence

FL

Chemiluminescence

CL

Optical Rotation

OR

Electro Chemical

EC


1. UV, VIS, and PDA Detectors

The UV, VIS, and PDA detectors are categorized as absorbance detectors. They provide good sensitivity for light-absorbing compounds at ~pg level. They are easy to operate and provide good stability. UV detector is a very commonly used detector for HPLC analysis. During the analysis, sample goes through a clear color-less glass cell, called flow cell. When UV light is irradiated on the flow cell, sample absorbs a part of UV light. Thus, the intensity of UV light observed for the mobile phase (without sample) and the eluent containing sample will differ. By measuring this difference, the amount of sample can be determined. Since the UV absorbance also differs depend on what wavelength is used, it is important to choose an appropriate wavelength based on the type of analyte. A standard UV detector allows user to choose wavelength between 195 to 370 nm. Most commonly used is 254 nm. Compared to a UV detector, a VIS detector uses longer wavelength (400 to 700 nm). There are detectors that provide wider wavelength selection, covering both UV and VIS ranges (195 to 700 nm) called UV/VIS detector.
PDA detects an entire spectrum simultaneously. UV and VIS detectors visualize the obtained result in two dimensions (light intensity and time), but PDA adds the third dimension (wavelength). This is convenient to determine the most suitable wavelength without repeating analyses.


2. Refractive-Index Detector

Figure 1

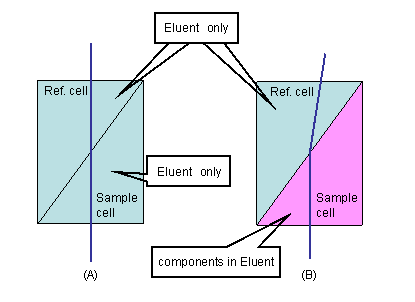
RI detector measures change in reflex index. A glass cell is divided into two chambers (cells). The effluent from LC column flow through the "sample cell", while other cell called "reference cell" is filled with only mobile phase. When the effluent going through the sample cell does not contain any analyte, the solvent inside both cells are the same (Figure 1A). When a beam is irradiate on the cells, the observed beam will be straight in this case. However, in a case the effluent contains any components other than mobile phase; bending of the incident beam occurs due to the reflex index difference between the two solvents (Figure 1B). By measuring this change, the presence of components can be observed.
RI detector has lower sensitivity compared to UV detector, and that's the main reason why RI is not as commonly used as UV. However there are some advantages over UV detector.

  • It is suitable for detecting all components. For an example, samples which do not have UV absorption, such as sugar, alcohol, or inorganic ions obviously cannot be measured by a UV detector. In contrast, change in reflective index occurs for all analyte, thus a RI detector can be used to measure all analyte.
  • It is applicable for the use with solvent that has UV absorbance. A UV detector cannot be used with solvent which has UV absorbance. Sometimes the organic solvent used for GPC analysis absorbs UV, and thus UV detector cannot be used.
  • It provides a direct relationship between the intensity and analyte concentration. The amount of UV absorbed depends on each analyte, thus the intensity of UV detector peak does not provide information on the analyte concentration. While intensity observed by a RI detector is comparable to the concentration of analyte.
    Because of those advantages, RI is often used for the detection of sugars and for SEC analysis.


    3. Evaporative Light Scattering Detector
    ELSD provides good sensitivity for non-volatile analytes at ng level. The column effluent is nebulized and then evaporated to make it form fine particles. The analyte is then radiated with a laser beam and the scattered radiation is detected. The target sample includes lipids, sugar, and high molecular weight analytes. It is used in the similar way as a RI detector, but can provide more sensitive detection with stable base line. Another advantage is that ELSD can be used for the gradient method whereas RI cannot.


    4. Multi-Angle Light Scattering Detector
    For the SEC analysis, MW of analyte is estimated from the calibration curve drown using a set of known standards. However, by using a MALS, MW can be determined directly without the need of calibration curve. Also MALS can provide an absolute MW of the analyte with very low detection limit.


    5. Mass Spectrometer
    The analytes are detected based on their MW. The obtained information is especially useful for compound structure identification. However, its use is not limited to structure identification and can be used to quantify very low detection limit of elemental and molecular components.


    6. Conductivity Detector
    Solutions containing ionic components will conduct electricity. Conductivity detector measures electronic resistance and measured value is directly proportional to the concentration of ions present in the solution. Thus it is generally used for ion chromatography.


    7. Fluorescence Detector
    The advantage of fluorescence method is its high sensitivity for selective groups of compounds at ~fg level. By using a specific wavelength, analyte atoms are excited and then emit light signal (fluorescence). The intensity of this emitted light is monitored to quantify the analyte concentration. Most pharmaceuticals, natural products, clinical samples, and petroleum products have fluorescent absorbance. For some compounds which do not have fluorescence absorbance or low absorbance, they can be treated with fluorescence derivatives such as dansylchloride. The system is easy to operate and relatively stable.


    8. Chemiluminescence Detector
    Similar to FL, but instead of using a light source to excite the analyte atoms, the excitation is initiated by chemical reaction. Since it is not relied on the external excitation source, the noise is small, results in high signal to noise ratio, i.e. it provides even higher sensitivity than FL.


    9. Optical Rotation Detector
    Specific for the optical isomer measurement. The column can separate R- and L- type optical isomers, but the general detectors (e.g., UV) cannot distinguish which is R nor L. OR detector provides this information.


    10. Electro Chemical Detector
    There are several different types of ECs. The detection is based on amperometry, polarography, coulometry, and conductrometry. They offer high sensitivity, simplicity, convenience, and wide-spread applicability. It is especially suitable for the use with semi-micro or capillary type system.

HPLC USEFULL COLUMN TYPS AND DISCRIPTION


 Ion Exchange Column

The N and S ends on the magnet attract each other while N and N or S and S ends will repeal each other. The similar phenomenon occurs for electronics: Positive charge and negative charge attract each other while positive and positive or negative and negative charges repeal each other. When compounds dissociate and become ions, they will have electronic charges. Positive ion is called cation and negative ion is called anion.
Ion exchange mode uses ionic attraction and repulsion forces. What is different from magnet is that N end of magnet is always N, but molecular ion like protein can be an anion or a cation depending on the surrounding conditions (mobile phase). By changing the electronic characteristics of the mobile phase, the electronic charge of each component in the sample also changes. They may change from cation to anion (or vice versa) and this creates the interaction between the component and the packed gel. One time it may cause attraction and other time it may cause repulsion. Since the components that experience repulsion will be eluted out (and attraction causes retention) from the column, each component is separated based on their ionic strengths.
It is common to change the mobile phase during an analysis for ion exchange mode. Such method (changing mobile phase) is called gradient method. Most frequent method used for gradient elution is to prepare two mobile phases and change the ratio of two solvents over a time. Contrast to gradient method, the method uses single solvent throughout the run is called isocratic method.
Packed gel for ion exchange column is modified with either anion or cation functional groups. Commonly used functional groups are followings.

Quaternary ammonium (QA)  : Strong anion exchanger 
Diethyl aminoethyl (DEAE) : Weak anion exchanger
Sulfopropyl (SP)          : Strong cation exchanger
Carboxylmethyl (CM)       : Weak cation exchanger

Gels generally used are porous gel (having pores on the surface). However for the ion-exchange gel, small-sized gel (2.0-2.5 um) without pores is sometimes used. Gels without pores are called non-porous gel and it is effective for fast analysis. Both polymer-based and silica-based columns are used for ion-exchange columns. Though unlike RP columns that mainly uses silica base, ion-exchange columns requires use of alkali conditions sometimes, so importance of polymer-based materials is higher with ion-exchange columns than RP columns. Ion exchange is frequently used in biochemistry area such as separation of protein, peptide, and nucleic acids.


2. Ion Chromatography Column
There are two types of Ion Chromatography methods: The suppressor method and non-suppressor method. Shodex carries columns suitable for both types. As the name tells, the suppressor method uses a suppressor which removes ions that interfere with analytes measurement. The suppressor system is expensive, but some say the sensitivity of suppressor method is superior to non-suppressor method. In contrast, system required for non-suppressor method is cheaper, but the useable solvent is limited to the ones with low conductivity such as phthalic acid.

2.1 Suppressor Type Ion Chromatography Column
Shodex IC SI-90 and SI-50 are the suppressor type anion chromatography columns. SI-50 is the higher performance type of SI-90. SI-52 is another suppressor type column suitable for the separation of oxyhalides.

2.2 Non-Suppressor Type Ion Chromatography Column
Shodex IC I-524A and NI-424 are the non-suppressor type anion chromatography columns. NI-424 is the higher performance type of I-524A. Shodex IC YK-421 and YS-50 are the non-suppressor type cation chromatography columns. YS-50 is the higher performance type of YK-421. They can separate both monovalent and divarent cations simultaneously.

2.3 Other Columns
There are other columns available for specific applications, such as for separation of transition metal and rare earth metal ions.


3. Ion Exclusion Column
Compared to ion-exchange column that uses attractive force between anion and cation, ion-exclusion mode uses repulsive force between the anion of analyte and packed gel. Ion-exclusion mode is not use solely: Generally it is a fine balance used with other separation modes such as partition/adsorption mode. For an example, partition/adsorption mode will work to retain the analyte while ion-exclusion will try to exclude analytes. Ion-exclusion mode is often used for organic acid analysis.


4. Ligand Exchange Column
The packed gel used for a ligand-exchange column is modified with substances with ionic functional group. The modifier contains metal cation, which is called "counter ion". The ligand exchange mode is often used for the separation of saccharides using the interaction between positive charge of metal cation and negative charge of hydroxyl group (OH-) on saccharide. The number of OH- as well as their configurations influences the strength of interaction. Counter ions used include calcium, lead, zinc, and sodium. Often the separation works under combinations of size exclusion and ligand exchange and partition/adsorption and ligand exchange modes.


5. Affinity Columns
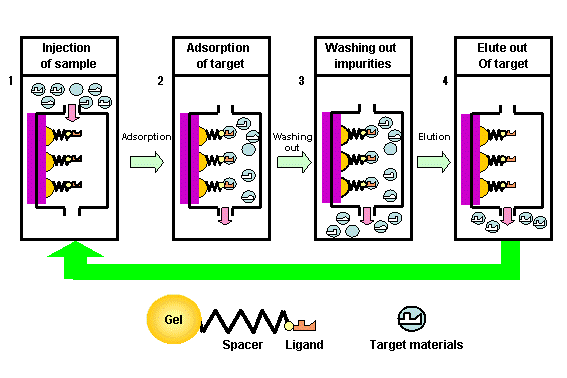
The separation mode of affinity column is different from other separation modes explained earlier. The packed gel is modified with so called ligands – similar to the functional groups. The ligand captures only a specific compound. It is similar to key and lock: Among many keys, only one specific key can open the lock. When sample containing mixed components is injected into an affinity column, only a specific component is retained by the ligand and all other components are going to be eluted. By changing the mobile phase, trapped component can be removed from the ligand and eluted. Figure below illustrates the affinity mode separation.

Figure 1


6. Chiral Column
Frequently compounds used for pharmaceutical material production has optical isomers. Optical isomerism is one type of stereoisomerism that two molecules have the same arrangement of atoms, but they have different orientations in space. One has a mirror image of the other and cannot be superimposed. Another familiar example is right and left hands. They have same shape, but cannot be superimposed. The asymmetric molecule is called chiral. When a beam of light is emitted to the pair of chiral compounds, one rotates the light to clockwise (dextrorotatory isomer, designated d or +) and the other rotates into counterclockwise (levorotatory isomer, designated l or -).
One famous story of chiral compound is thalidomide incident in late 1950s. Thalidomide was sold as a sedative drug and was thought that it does not give much side effect to pregnancy, thus was taken frequently by pregnant women. However it resulted in many severe birth defects. This is due to the chiral compounds; one has sedative effect while other is a potent teratogen. Chiral pairs are very alike but once they are taken by human (animals), their biological activities may be totally different from each other. A problem is that it is difficult to produce only one type of chiral compound during the production of pharmaceutical materials. As mentioned, leaving non-target chiral compound may cause another incident as thalidomide, and thus it is important to separate chiral compounds.
When separating two components by HPLC, the larger the difference in components' characteristics, the easier the separation. Thus, since chiral pair is very similar, it is extremely difficult to separate. Shodex provides optical isomer separation columns using different ligands: α-, β-, and γ- cyclodetrin derivatives, L-amino acids derivatives, and bovine serum albumin ligands. Each works under different mechanisms. For example, one uses conformational compatibility differences while other uses metal complex formation capacity differences of the isomers.


7. Preparative Column
The columns mentioned so far were "analytical columns" with column internal diameter (ID) of 4.6 ~ 8.0 mm. Purpose of using preparative column is collecting target substances after separating from other substances. Analysis column can separate these substances, but treating amount per column is not so much. On the other hand, preparative columns, larger diameter than analytical columns, can increase treating amount per column. Generally large particle size of packing materials is applied for preparative column, but there are cases the same packing materials are used.
There are mainly two reasons for collecting components: (1) to use in other analysis and (2) to use for industrial products.
(1) By using HPLC separation, chromatogram obtained shows the peaks corresponding to the components in the sample. For unknown analyte, the position of peak does not tell any information about the composition of the peak. Thus it requires to collect the unknown peak (analyte) and by using other technique to find out the composition of the analyte. Often mass spectrometer (MS) is used for the identification. Coupling HPLC and MS online is becoming common and the unit system is also commercially available. Also in some research, a certain components of the sample may be required to be used in next experimental sample. By using a preparative column, the specific component can be obtained.
(2) Use in a large scale collection and/or purification.
For preparation of certain products (often for the production of pharmaceutical products), it requires to separate and collect a certain components of raw material in a large scale. The preparative column will be used as a production tool.
For (1), the amount collected will not be so large, thus 20 mm ID preparative column is used. If concentration of target compound in the sample is relatively high, smaller ID column might be sufficient for the purpose. For (2), use in production, the larger ID column such as 50, 100, or 200 mm is generally used.


8. Guard Column
The presence of impurities in the sample may cause alternation of column by being deposited inside the column permanently. To prevent such problems, it is necessary to pre-treat the sample by centrifugion and/or filtration. However, there are components that cannot be removed by centrifugion/filtration. If those samples were injected, it may break the column.
The guard column is effective preventing the analytical column from being alternated by those impurities. The guard column is a smaller version of the analytical column; packed with the same type of gels as that is in analytical column. The guard column is placed before the analytical column, thus any potential impurities that may cause damages is trapped inside the guard column before it reaches the analytical column. The price of a guard column is generally about one third to one tenth of the analytical column. By using the guard column, it can enhance the analytical column life and thus can be more economical. Although for the relatively low-priced analytical columns, the price of guard column compared to the analytical column could be high. Thus for those columns, the corresponding guard column may not be available. Moreover, the use of guard column is more effective for the polymer-based columns that have expected long column lives compared to silica-based columns

Concept of Size Exclusion Chromatography column

 Size Exclusion Chromatography column


1.1 Theory of SEC mode
The separation modes explained earlier use chemical and/or ionic characteristics of packed gel and analytes. In contrast, SEC is completely different from other separation modes as it using analytes' physical characteristics.
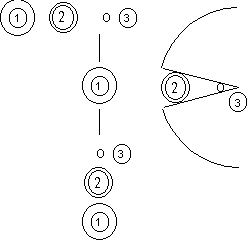
 

Figure 1aFigure 1b

As explained previously, there are pores on the surface of packed gel. Figure 1a illustrates the SEC separation: The smallest components in the sample mixture (3) cam enter deep into the pore. While larger component (1), cannot enter the pore. The middle-sized component (2) enters the pore in some depth. The components that can enter the pore deeper obviously will spend longer time in the column, thus the elution sequence is biggest to smallest: (1) > (2) > (3). As shown, the SEC separates components according to their sizes. If the diameter of a component is equal to the maximum pore size, like (4) (Figure 1b), it will not be able to enter the pore, and thus will not be retained. For any components bigger than (4), such as (5) and (6), will also not be retained. This means that even they are different in sizes, they will not be separated. The minimum molecular weight (MW) that cannot enter the pore (in this case (4)) is called exclusion limit. In another word, components bigger than the column's exclusion limit cannot be separated by the column. It is important to choose a column that is suitable for the target compound analysis. At Shodex we offer columns packed with wide range of pore-sized gels. The exclusion limit for each column is listed in our catalog. For the best separation, it is recommended to choose a column with smaller exclusion limit, but which covers the MW of the analyte.
MW of a compound is calculated from adding the atomic mass of each component. For example, methylalcohol (CH3OH) contains four hydrogen (atomic mass 1), one carbon (atomic mass 12), and one oxygen (atomic mass 16).
Thus MW of methylalcohol is 1 x 4 + 12 x 1 + 16 x 1 = 32.
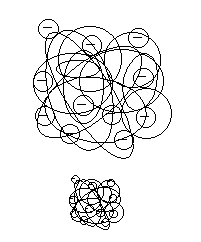
Figure 2

However, it is important to note that MW and the actual molecular size are not always equal when comparing different compounds. As figure 2 shows, even when two compounds have the same MW, one may have less-dense structure while other have very dense structure, so they have different molecular sizes. Even for the same compound, if different solvent was used to dissolve the sample, it can change the molecular structure and consequently it may change its size. The exclusion limit listed in our catalog indicates the standards and conditions used. If the same condition and the sample were to be analyzed, there will not be a concern, but if either condition or sample is different, the listed exclusion limit can be only used as a reference.

1.2 Molecular Distribution Analysis
For the separation modes explained earlier were used to separate each component in a sample. In addition to the separation purpose, SEC is also used to determine the MW distribution of a sample. For an example, polystyrene has a structure as shown below, i.e., it is made of repeating unit of styrene C6H5CH=CH2.

Figure 3


The MW of styrene is 104, thus polystyrene with MW 1,040,000 is made of 10,000 styrene. Although, during the actual production of polystyrene, it is impossible to make compound only with 10,000 styrene. Instead, there will be a variation and the end product will be a mixture of 10,000 styrene unit as well as one with 10,012 styrene units, 9,985 styrene units etc… The mixture will show distribution in its MW with 10,000 as the mode.
In order to obtain a MW distribution information, first it requires a preparation of calibration curve: A set of calibration standards with known MW (Figure 4) is analyzed and then elution time vs. log MW of the calibration standard (Figure 5a) is plotted. The line connecting those plots is the calibration curve. Next step is to analyze the actual sample. In this example, the sample peak started from 13.9 min to 18.8 min. This indicates that the sample contained components with MW 6,200 to 1,100,000 (Figure 5b).

Figure 4Figure 5


MW
9,120,000
1,100,000
400,000
128,000
33,000
6,200
1,350
Elution time
12.3min
13.9min
14.8min
15.8min
17.1min
18.8min
20.0min
 Figure 6

It is important to determine the MW distribution of polymers to understand their physical properties. There are also other indexes important for understanding polymers' properties. They include weight average (Mw), number average (Mn), and peak average (Mp). Mp can be obtained from the position of peak top, in the above example, it is ~100,000 Da. However, obtaining the values for Mn and Mw requires a complex calculation. Many of recent software is designed to provide those values automatically.
The actual calibration curve looks like figure 6. Any components with MW larger than exclusion limit will be eluted together. Also there are ranges show linearity and no-linearity. Only the MW range that provides linearity can be applied for the MW determination.

Figure 7

1.3 Separation Based on SEC
In addition to the MW distribution determination, SEC is also used to separate components. In general, the SEC column packed with gels having a large pores (large exclusion limit) is used for the MW distribution determination of polymers, while the one with smaller pores (small exclusion limit) is often used for the separation of small components.
For example, figure 7 shows the separation efficiency comparison of two columns. Three components were to be separated. Each column provides different calibration curves: Column 2 that has smaller slope provides better separation between the three components.
This is true for any other SEC columns; the column with smaller slope calibration curve will provide better separation compared to the one with bigger slope.

1.4 Type of SEC
There are two types of SEC: One uses organic solvent and the other uses aqueous solvent as a mobile phase. The one uses aqueous solvent is called Gel Filtration Chromatography (GFC) or aqueous SEC. The first GFC method was developed by J.Porath and P.Flodin in 1959, in Sweden. They used a cross-linked dextran gel to separate proteins. The columns filled with cross-linked dextran gels are still commercially available, but there are many other types of gels developed and used in biochemistry and pharmaceutical fields.
In contrast, the one uses organic solvent such as tetrahydrofuran (THF) or chloroform is called Gel Permeation Chromatograpny (GPC) or organic SEC. The first GPC method was developed by J.Moore in1964 US. The cross-linked polyethylene gel was used for the MW distribution analysis of synthesized polymers. Even after the big improvement of HPLC, the method used by J.Moore is still a very effective one for the MW distribution analysis of hydrophobic polymers and oligomers.


2. Gel Filtration Chromatography (GFC)
GFC columns are available in silica and polymer-base. When comparing the two types, the slope of the silica-column calibration curves is smaller. Thus, the separation efficiency is higher for the silica column. However, very large pore-sized silica gel cannot be prepared due to its structural fragility. Whereas the structure of polymer gel is stronger than silica, it is possible to prepare polymer gels with large pores. In addition, since polymers have stronger chemical stability than silica, it can be used with wider selection of solvents. Silica columns are often used for the separation of protein, glycoprotein, peptide, and nucleic acid. Polymer columns are used for the similar application as silica columns, but can also be used for the MW distribution analysis of aqueous-soluble large polymers.


3. Gel Permeation Chromatography (GPC)
For GPC columns, polymer based gel is used. Most frequently used is polystyrene divinylbenzene copolymer. It is important to find a solvent that can completely dissolve the sample. In general, the solvent used to dissolve the sample will be used as a GPC mobile phase. THF is one of the most often used solvents. Other commonly used GPC solvent includes chroloform, dimethylformamide (DMF), hexafluoroisopropanol (HFIP), quinolin, o-dichlorobenzene, tetrachlorobenzene etc… When using a solvent that is different from the shipping solvent, obviously the eluent has to be replaced. The eluent replacement requires careful steps to prevent potential damage on the packed gels.


4. Linear Column
The separation efficiency of SEC column increases as the length of column increases (With expense of analysis time and solvent consumption). In order to increase the separation efficiency, it is more common to connect multiple columns in series. For multiple column usage, generally columns with the same type are connected. For an example, 2 to 4 of Shodex GPC KF-806 columns can be connected in series. However, for the analysis of wider MW range sample, different columns are used together. An example is to connect GPC KF-804, KF-803, and KF-802 in series. A problem may arise when connecting different pore-sized columns is the linearity. Even though, each column provides linear calibration curves, when they are connected together, it does not necessary provide a straight calibration curve. Linear columns (mixed-gel columns) are developed in order to solve such a problem. A linear column is packed with a mixture of gels having different pore-sizes. The linear column covers a wider MW range analysis with a straight calibration curve. Thus, instead of using KF-804, KF-803, and KF-802 in series, using 3 x KF-804L will assure providing a straight calibration curve over a wide MW range (the linear columns are named ending with either L or M). Whereas, linear calibration type, LF series, is more recent type that is filled with multi-porous gels, i.e., on the surface of single gel, there are pores with different sizes. This provides even better linearity than linear columns. Figure 8 illustrates the differences between the columns and resulting peaks obtained by each column. Linear types are especially recommended for the MW determination of compound having a wide MW distribution.


Figure 8


5. Downsized Column
It is a very common request that researcher would like to decrease the analysis time. Also considering the environmental issues, it is preferred to reduce the organic solvent usage. By reducing the column size, it can reduce the analysis time as well as solvent consumption. However, by simply reducing the column size, it will also lower the separation efficiency. In order to reduce the column size while keeping the separation efficiency, it is necessary to make the gels smaller. The resulted columns are called downsized columns. Shodex GPC downsized columns were developed in the order of 1 to 4 (Table below). The column volume is decreased and particle size of the gel used was also decreased.


Name of the column

Column Size
(ID mm x L mm)

Column Volume (mL)

Particle Size
(μm)

1. GPC A-800, AC-800, AD-800 etc

8.0 x 500

25.1

10

2. GPC KF-800, K-800, KD-800 etc

8.0 x 300

15.1

6

3. GPC KF-600 etc

6.0 x 150

4.2

3

4. GPC KF-400HQ etc

4.6 x 250

4.2

3

Guidance for column selection is such:
1. GPC A-800, AC-800, AD-800 series are the discontinued items.
2. KF-800, K-800, KD-800, HFIP-800 series are the standard GPC columns.
3. KF-600, K-600, HFIP-600 series are the rapid analysis downsized columns.
4. KF-400HQ series are for the high performance analysis.
Type 3 and 4 require a use of semi-micro type HPLC system in order to provide the desired improvements. Thus, unless such a system is available, standard column (Type 2) is recommended.


6. Analysis of Polymers that Require Special Conditions
For the samples that cannot be dissolved in regular GPC solvent such as THF, chloroform, and DMF, there are two methods that are commonly used. They are (1) High temperature GPC method and (2) HFIP solvent method. Their details are explained below.

6.1 High Temperature GPC
Some plastic materials such as polyethylene (PE) and polypropylene (PP) does not dissolve in organic solvents at room temperature. Since they dissolve at elevated temperatures around 140 to 150°C, GPC analysis can be carried at this high temperature conditions. GPC HT-800 series is filed with toluene and suitable for the analysis between 100-150°C. Some analysis requires even higher working temperature, and for those, GPC UT-800 series can be recommended with a use up to 210°C.

6.2 HFIP
As mentioned, some samples require high temperature to be dissolved and analyzed. In order to analyze sample at the elevated temperature, it requires special high-temperature GPC system. A disadvantage apart from its high capital cost, the high-temperature GPC system requires a long warm-up time to stabilize its temperature.
Polyethylene terephthalate (PET) used for clear-plastic bottles, polybutyl tetraphtalate (PBT), and/or nylon have been thought to require a high-temperature GPC system for the analysis. However, it was found that they dissolve in HFIP at room temperature. As the name suggest, GPC HFIP-800 series column is filled with HFIP and suitable for mentioned compound analysis at room temperature. The price of HFIP is much more expensive than other generally used organic solvent, but considering the price of high-temperature GPC system installation, it is not so extreme. Moreover, the solvent can be recycled after distillation. Therefore the running cost of HFIP method is not as expensive as it might be thought.


7. Multi-Mode Column
Asahipak GS-HQ series column is a very unique column. Basically, GS-HQ series column is a SEC Column, but more efficient method for the column is to use as a multi-mode column by selecting a certain solvent. What Shodex call muti-mode is a mixed separation mode, providing a combination of two or three of SEC, ion-exchange, and/or partition/adsorption modes. Regular GFC columns may also work under mixed separation mode when mobile phase is not properly optimized. Generally speaking, the conditions providing something other than pure SEC mode is not preferred as it interfere with MW measurement. However, GS-HQ series is designed to provide multi (mixed) separation modes. In some analysis, a desired separation cannot be obtained by single SEC, ion-exchange, and/or partition/adsorption modes, but the multi-mode may solve this problem. A disadvantage of multi-mode is that it is difficult to predict a separation pattern, in other word; there are chances of separation which was not able to be done by any other single separation mode.


8. Multi-Solvent Column
Generally GFC column cannot be used with non-polar organic solvents and similarly, GPC column cannot be used with aqueous solvents. If "wrong" solvent was used, it will break the column. However, GF-HQ series column can be used with many different solvent that are used for both GFC and GPC analysis. A column that is usable under such a wide solvent selection is very rare and unique to Shodex.
COVISHIELD™ Overview , You should know.....

  ChAdOx1 nCoV- 19 Corona Virus Vaccine (Recombinant) COVISHIELD™                                                                           ...

Most Popular Post